Every analyst takes analysis context on their decision on the analysis result. If a residue of a pesticide never authorised in a crop production site is identified, extra confirmation of the finding is performed. In clinical analysis, if a specific analysis result is not supported by patient symptoms, it can be decided to repeat the analysis using the same or a different analytical method. In the XVIII century, Thomas Bayes developed the mathematical framework, Bayes’s Theorem, for dealing with analysis context in analysis result interpretation. This text briefly describes how this applies to qualitative analysis, i.e. analysis where the outcome is of a binary nature, such as evidence or no evidence of compound presence in a sample or composition equivalence of two analysed samples.

The end-user of a SARSCoV-2 antigen test is interested in knowing the change of being infected and not the chance of an injection being detected. |
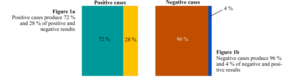
When a fast SARS-CoV-2 antigen test is purchased, it provides the rate of true positive and true negative results, designated sensitivity (SS) and specificity (SP). If, for instance, SS is 72 %, a tested sample from a truly infected person has a 72 % chance of producing the colour change indicating infection (a true positive result). For an SP of 96 %, when a biological sample from a not infected person is analysed, there is a 96 % chance of being indicated no infection (a true negative result). From this information, it is also possible to know that there is a 28 % chance (100% ̶ 72 %) of not being detected a true infection (false negative result) and of 4 % of a no infection being reported as a false infection (false positive result). Although interesting and valuable, these probability levels are not the information the end user of the antigen test is seeking. The SS and SP reports on test performance, i.e. the chance that a real case is correctly identified; it starts from an actual case and gets the change of a specific result. However, when someone does the antigen test, they want to know if it is infected instead of the chance of an infection being correctly determined (i.e. the other way around). The starting point is the result and not the case as for SS and SP determination.
The SS and SP and their complementary values (100 ̶ SS) and (100 ̶ SP) can be visually represented by the following independent figures:
These figures can be merged with the analysis context; in this example, the prevalence of SARS-CoV-2 infection in the tested population to provide the chance of a positive result from a sample of the studied population being true. The following figures present the transfer of the SS and SP to a population of high or low positive case rates, i.e., with many or a few infected persons. |
If the sample is originated from a population where 60 % or only 10 % of people are infected, the analysis scenario is represented by Figures 2a and 2b, respectively.
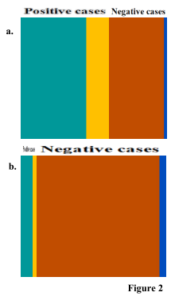 |
Figures 1a and 1b were squeezed or expanded to have the size from 60% to 40%, or 10% to 90% of the population.
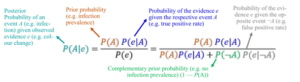
If Figure 2a is analysed, it can be observed that we have (60 % × 72 %) = 43.2 % of true positive results (72 % of the 60 % positive cases), 16.8% of false negative results (60 % × 28 %), 38.4 % of true negative results (40 % × 96 %) and 1.6% of false positive results (40 % × 4 %). Bayes theorem formulates that, given a positive result (e.g. colour change indicating infection), the probability of the results being truth, i.e. of the individual being infected, P, is the ratio between the probabilities of true positive results, and of the result being positive regardless from positive or negative cases.
The P is designated the posterior probability. The infection prevalence of 60 % is the prior probability available before using the infection test. If no test on samples is performed, there is a 60 % chance that the individual is infected. After observing a positive result from the test with claimed performance, the prior probability is Figure 2 updated to 96.4 % (the posterior probability). If the prevalence of infection is 10 %, an equivalent positive result is associated with a P = 67%.
|
To close this brief explanation, it is only necessary to mention that several probabilities used in Baye’s theorem are conditional probabilities presented in the notation below.
This theorem also allows us to quantify how qualitative analysis improves if additional evidence of the event is collected. When no reliable prior probability is available, it can be decided to report results with alternative metrics. All these are discussed in the Eurachem/CITAC guide on qualitative analysis [1].
Reference
[1] R Bettencourt da Silva and S L R Ellison (eds.) Eurachem/CITAC Guide: Assessment of performance and uncertainty in qualitative chemical analysis. First Edition, Eurachem 2021.
Available from https://www.eurachem.org.